


In the context of financial markets, the candlestick pattern is a pictorial/visual representation of price movement, which appears as a series of candlesticks on a chart. Candlesticks patterns came from the Japanese rice traders in the 18th century and these has become a fundamental tool for the analysis of the future prices. There are two types of candlestick patterns, bullish candlesticks patterns and bearish candlesticks patterns. Investors and traders use this pattern because they allow complex market data to be expressed in a simple format.
Candlestick patterns are a form of technical analysis used in stock trading to predict future price movements based on past price behaviour. These patterns help traders understand market sentiment and make informed trading decisions.
How to read candlestick
Each candlestick represents a specific time period (e.g., 1 minute, 1 hour, 1 day) and displays four key price points:
- Open Price – The price at which the trading period started.
- Close Price – The price at which the trading period ended.
- High Price – The highest price reached during the specified period.
- Low Price – The lowest price reached during the same period.
Candlestick patterns help traders identify market sentiment, trends, and potential reversals.
Bullish candlesticks patterns are formations that suggest the price of an Index/stock may rise. Bullish candlesticks patterns are commonly used to identify potential entry points for making long positions (buying).
Here, the most common bullish candlesticks patterns include
Hammer Candlestick
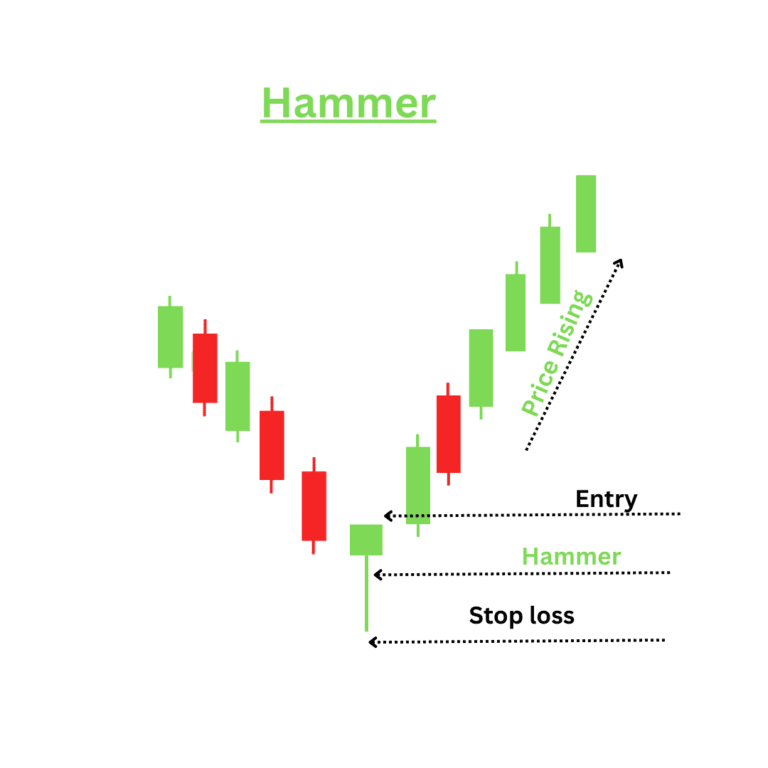
- The hammer is a Bullish candlesticks pattern commonly used in technical analysis to signal potential reversals in a downtrend. The hammer has a small body at the upper end of the trading range, with a long lower shadow (at least twice the length of the body) and little to no upper shadow.
- The hammer suggests that despite sellers pushing the price down during the trading period, buyers managed to bring it back up, showing potential for a reversal. Traders often look to enter a long position after confirmation of the hammer pattern with a subsequent bullish candle.
Bullish Engulfing
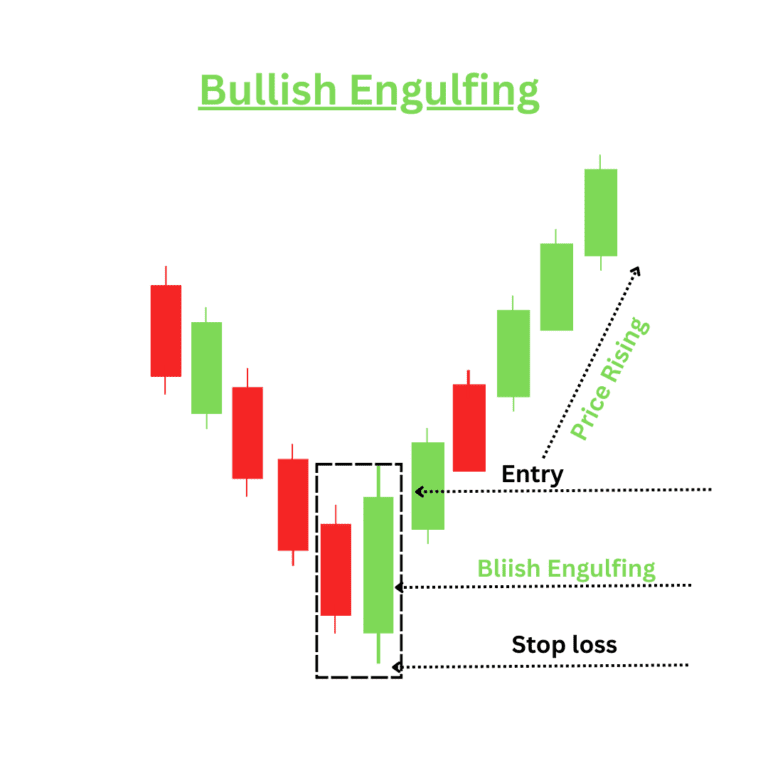
- The bullish engulfing pattern is a bullish candlesticks pattern formation that signals a potential reversal from a downtrend to uptrend.
Structure of the bullish engulfing pattern:
- First candle: A small bearish (red) candle, that indicating selling pressure.
- Second Candle: A larger bullish (green) candle, that completely engulfs the body of the first candle i.e. previous candle. It shows that buyers have taken control over sellers.
Characteristics:
- This pattern indicates a shift in momentum from sellers to buyers, suggesting that the price may begin to rise.
- This pattern typically appears at the bottom of a downtrend.
- Confirmation: Increased volume on the bullish candle enhances the validity of the signal, suggesting strong buying interest. Enter a long position when the price breaks above the high of the bullish engulfing candle or after confirming bullish candle.
The Morning Star
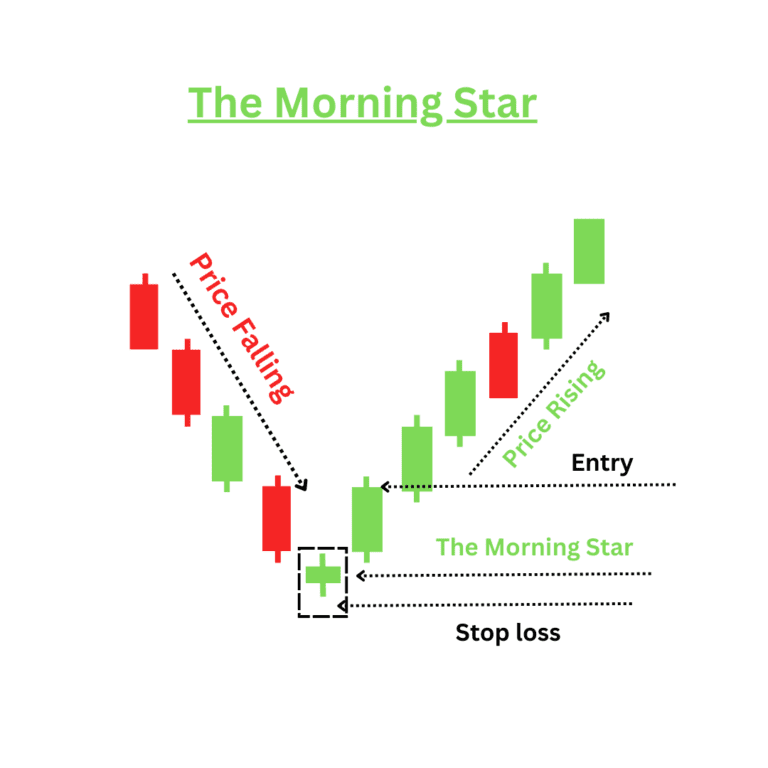
The Morning Star is also a bullish candlesticks pattern that typically signals a potential reversal from a downtrend to an uptrend.
Characteristics of the Morning Star:
- Formation: This bullish canlesticks pattern consists of three candles:
- First Candle: A bearish candle (often red or black) that confirms the downtrend.
- Second Candle: A small-bodied candle (can be bullish or bearish) that gaps down from the first candle, indicating indecision. This candle often has a lower close than the first candle.
- Third Candle: A bullish candle (green or white) that closes above the midpoint of the first candle, confirming the reversal.
- The morning star pattern typically appears at the bottom of a downtrend, suggesting that selling pressure may be weakening and buyers are starting to take control. While the morning star itself is a strong reversal signal, traders often look for confirmation through increased volume or subsequent bullish candles.
Bullish Marubozu
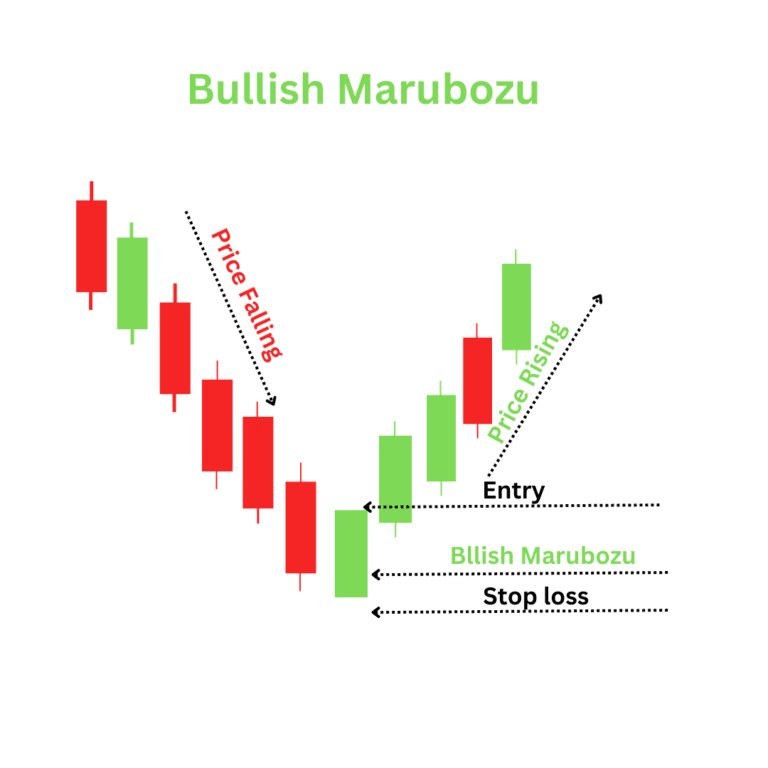
A Bullish Marubozu is signifies strong bullish sentiment in the market. This bullish candlesticks indicates that buyers were in control throughout the trading session, often signalling a continuation of an uptrend or the beginning of one.
The bullish candlesticks shows that buyers dominated the market from the opening to the closing, pushing prices higher.
Like all candlestick patterns, a Bullish Marubozu should be confirmed with other technical indicators, such as volume analysis, moving averages, or support and resistance levels.
Bullish Harami Candlesticks
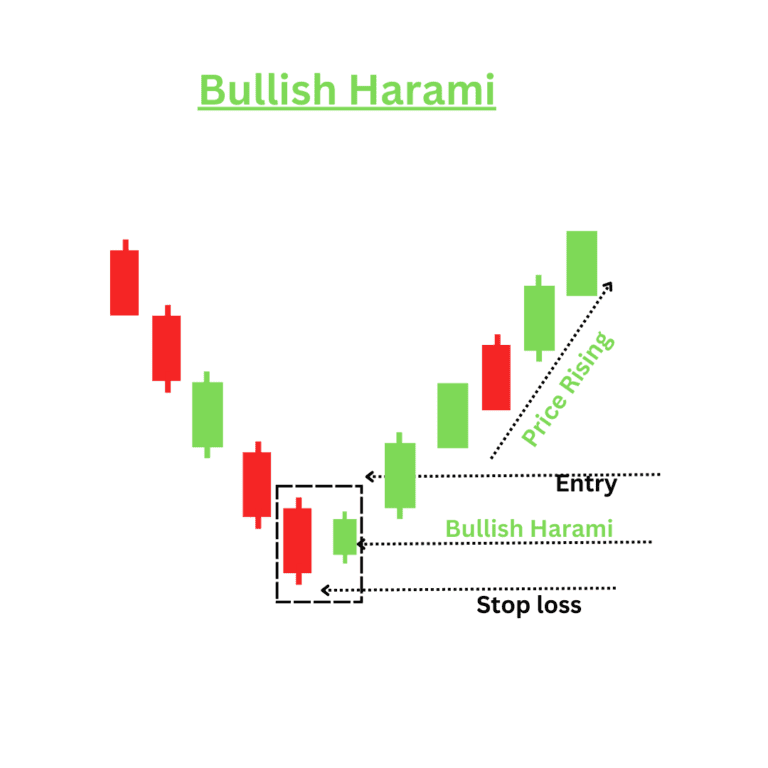
The Bullish Harami candlestick pattern indicates a potential reversal from a downtrend to an uptrend.
The pattern consists of two candles:
- The first candle is a larger bearish candle (often red or black), which indicates a continuation of the downtrend.
- The second candle is a smaller bullish candle (green or white) that is contained within the body of the first candle.
The bullish harami typically appears at the end of a downtrend, suggesting that selling pressure may be weakening and that buyers are starting to gain strength. Traders may consider entering a long position after confirmation from the next candle, particularly if it closes above the high of the bullish harami.
If you want gain more knowledge about candlesticks patters you may study following books
- Candlesticks Patterns Crash course by Pushkar Raj Thakur
- Price Action Trdading : Technical Analysis Simpified by Sunil Gurjar
Disclaimer
The content on this platform is for informational and educational purposes only and should not be considered financial, investment, or legal advice. While we strive to provide accurate and up-to-date information, we do not guarantee the completeness, reliability, or suitability of the information provided.
Before making any financial decisions, please consult with a qualified financial advisor or conduct your own research.


