


Candlestick patterns – Bullish Candlesticks and Bearish Candlesticks are essential tools in technical analysis, helping traders predict market movements. Among these patterns, bearish candlesticks play a crucial role in identifying potential downtrends. In this blog, we’ll explore what bearish candlesticks are, how they work, and some common patterns every trader should know.
What Are Bearish Candlesticks?
A bearish candlestick represents a period where the closing price of an asset is lower than its opening price. This indicates that sellers were dominant during that period, pushing prices down. These candlesticks are usually depicted in red or black in trading charts.
Key Characteristics of Bearish Candlesticks
- Open Price: The price at which the trading session starts.
- Close Price: The price at which the trading session ends (lower than the open price).
- High Price: The highest price reached during the session.
- Low Price: The lowest price reached during the session.
- Body: The difference between the open and close price, indicating price movement.
- Wicks (Shadows): Thin lines extending above and below the body, showing the highest and lowest prices during the session.
Common Bearish Candlestick Patterns
Bearish Engulfing
The bearish engulfing pattern is candlestick formation that signals a potential reversal from an uptrend to downtrend.
This pattern consists of two candles
- First candle: A small bullish (green) candle, which shows that buyers were in control during the previous period.
- Second Candle: A larger bearish (red) candle, that completely engulfs the body of the first candle. It shows that sellers have taken control over buyers.
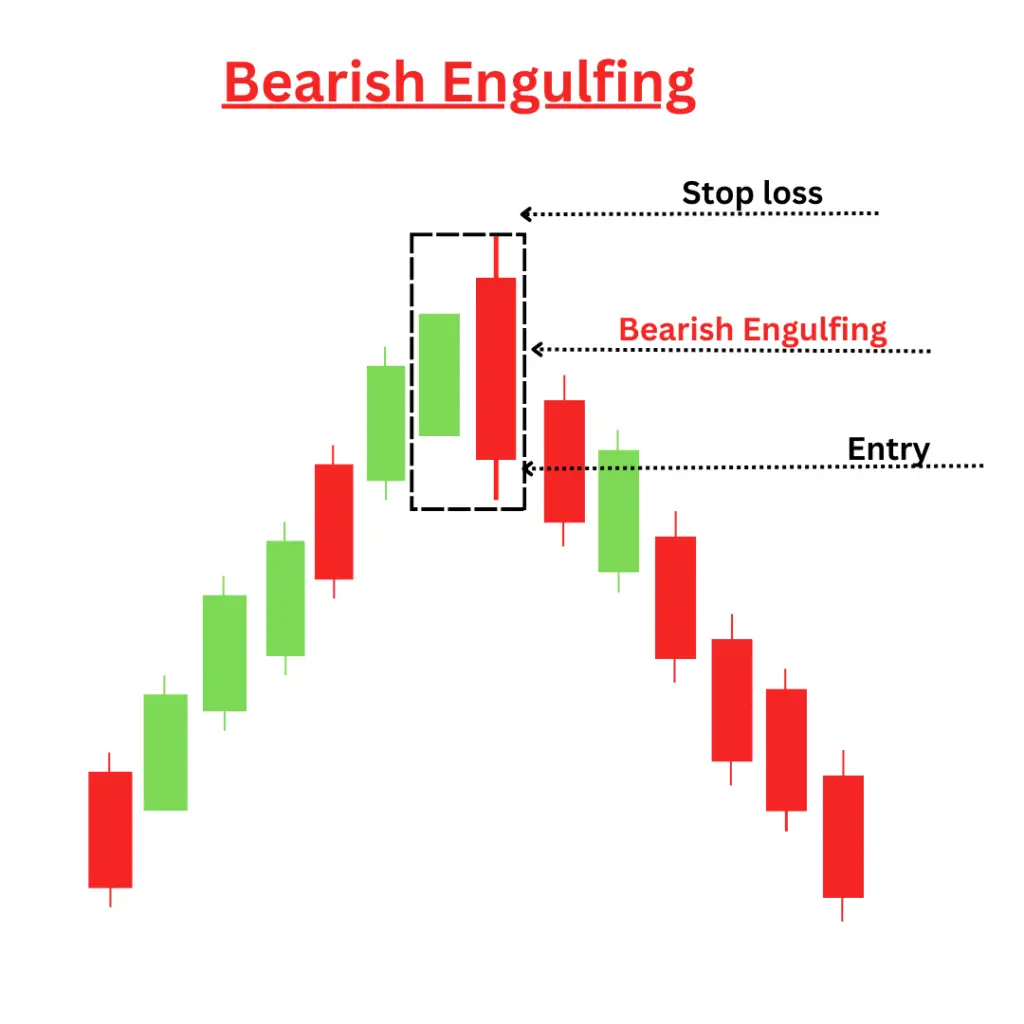
This pattern typically appears at the top of an uptrend and indicates a potential shift in momentum from buyers to sellers, suggesting that the price may begin to fall/decline.
Increased volume on the bearish candlesticks strengthens the signals, suggesting significant selling pressure. Enter a short position when the price breaks below the low of the bearish engulfing candle or after confirmation with a subsequent bearish candle.
Target levels can be set based on previous support levels or other technical indicators or according to your risk reward ratio.
Shooting Star
The Shooting Star is a bearish candlesticks pattern that typically appears at the top of an uptrend and signals a potential reversal.
The shooting star has a small body located at the lower end of the trading range, with a long upper shadow (at least twice the length of the body) and little to no lower shadow.
It usually forms after a price increase, indicating that the buying pressure may be weakening and that sellers may be starting to take control.
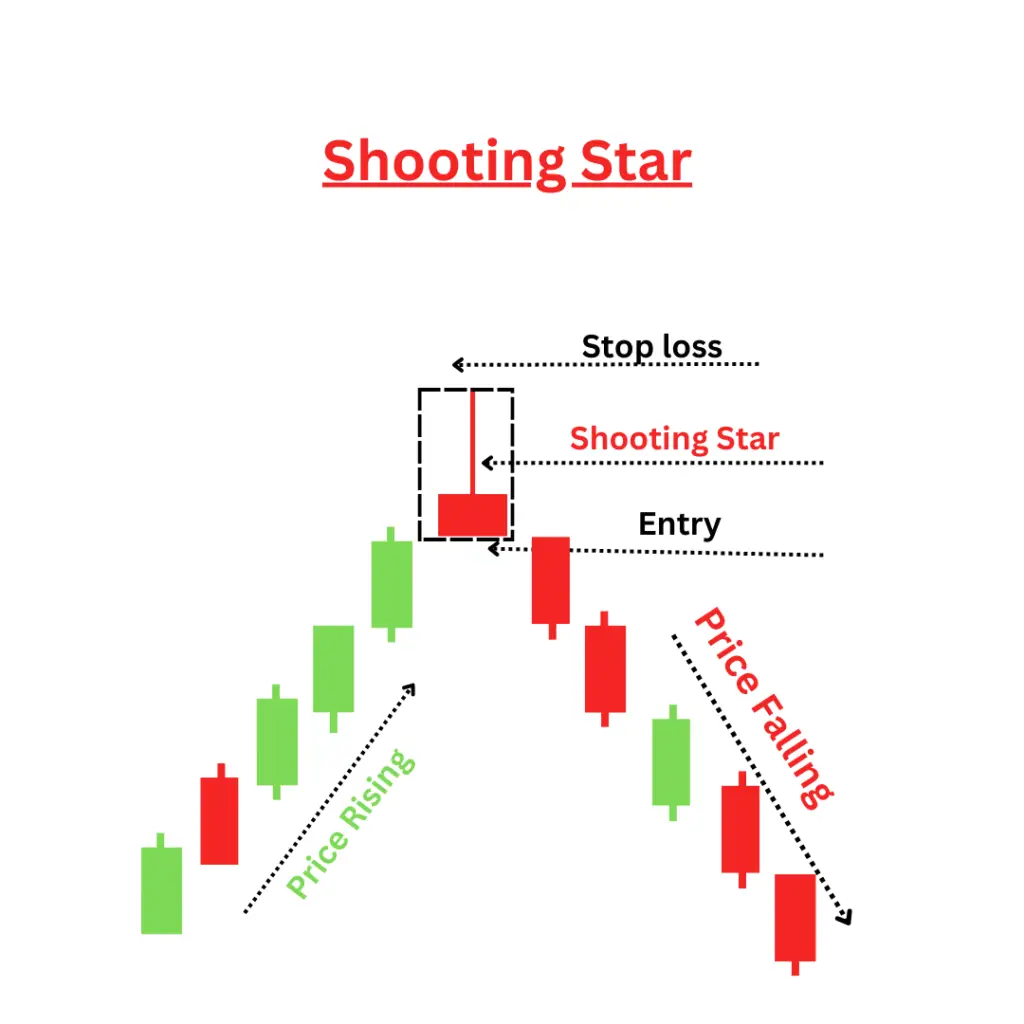
The shooting star indicates that, despite a strong buying period, buyers were unable to maintain the price, leading to a close near the open. This shift in sentiment suggests potential selling pressure.
While the shooting star is a strong reversal signal, confirmation is crucial. Traders typically look for a subsequent bearish candle that closes below the body of the shooting star to validate the reversal.
Traders often consider entering a short position after confirmation from a bearish candlesticks following the shooting star. Targets can be set based on previous support levels or other technical indicators.
The Evening Star
The “Evening Star” is a pattern that typically signals a potential reversal from an uptrend to a downtrend.
The pattern consists of three candles:
- First Candle: A bullish candle (often green or white) that confirms the uptrend.
- Second Candle: A small-bodied candle (can be bullish or bearish) that gaps up from the first candle, indicating indecision. This candle often has a higher close than the first candle.
- Third Candle: A bearish candle (red or black) that closes below the midpoint of the first candle, confirming the reversal.
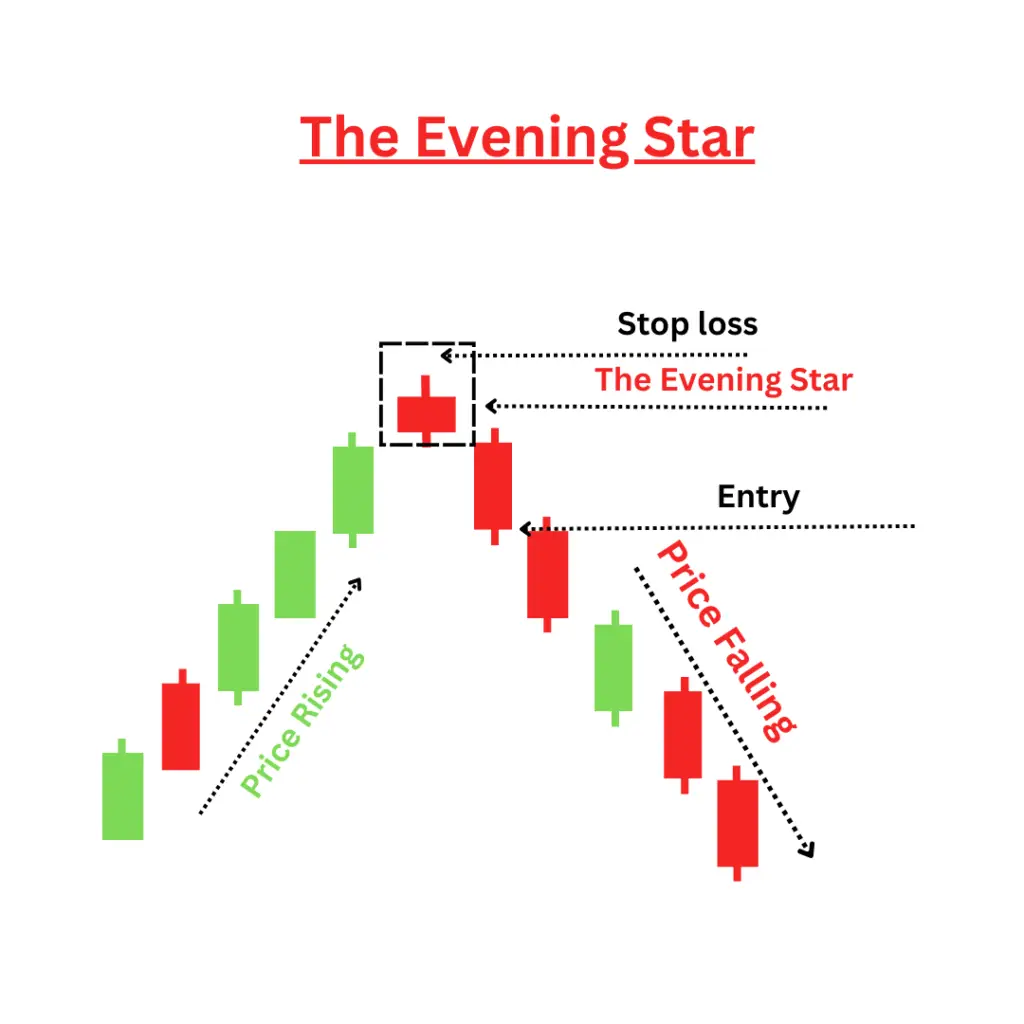
The evening star pattern typically appears at the top of an uptrend, suggesting that buying pressure may be weakening and sellers are starting to take control.
The evening star indicates that after a period of buying, sellers are starting to enter the market, which may lead to a reversal in trend. While the evening star itself is a strong reversal signal, traders often look for confirmation through increased volume or subsequent bearish candles.
Trading the Evening Star:
- Entry Point: Traders may consider entering a short position after the formation of the third candle, particularly if it closes below the midpoint of the first candle.
- Stop-Loss: A common strategy is to place a stop-loss above the high of the second candle to manage risk.
- Target Price: Targets can be set based on previous support levels or using other technical analysis tools.
Hanging Man
The Hanging man is a candlesticks pattern that appears at the top of an uptrend and signals a potential bearish reversal.
The hanging man has a small body located at the upper end of the trading range, with a long lower shadow (at least twice the length of the body) and little to no upper shadow.
It typically forms after an uptrend, suggesting that the buying pressure may be weakening and sellers are beginning to step in.
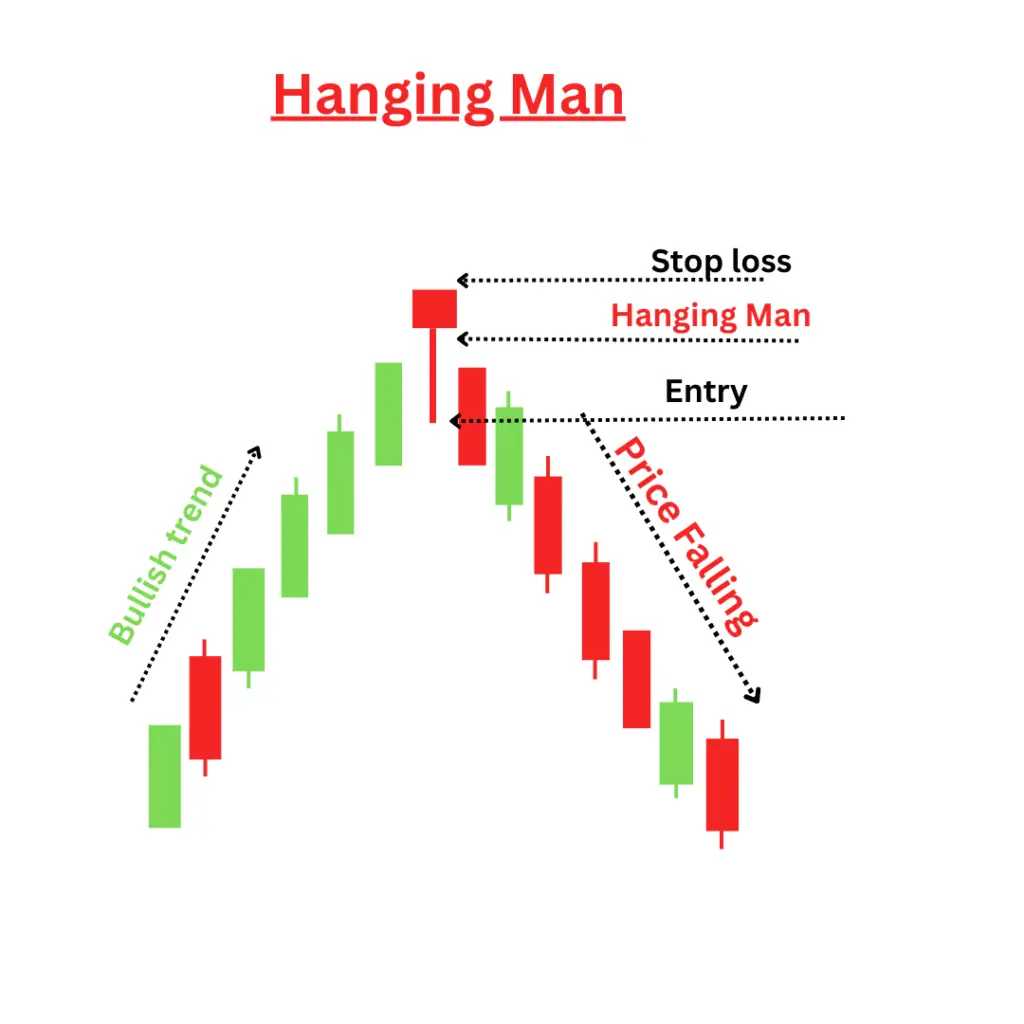
The Hanging man indicates that despite a strong buying period, sellers managed to push the price down significantly during the trading session. This shift in sentiment can suggest that a reversal may occur.
Traders typically look for a subsequent bearish candle (closing below the hanging man’s body) to validate the reversal signal.
Traders often consider entering a short position after confirmation from a bearish candle following the hanging man. Targets can be set based on previous support levels or other technical analysis tools.
Bearish Marubozu
A Bearish Marubozu is a bearish candlesticks pattern commonly found in technical analysis of stock charts. It represents strong bearish sentiment in the market, often signalling the continuation of a downtrend or the beginning of downtrend.
The candlestick has no wicks, i.e. the opening price is the same as the high price, and the closing price is the same as the low price. The candle’s body is solid and extends from the opening to the closing price, emphasizing strong selling pressure.
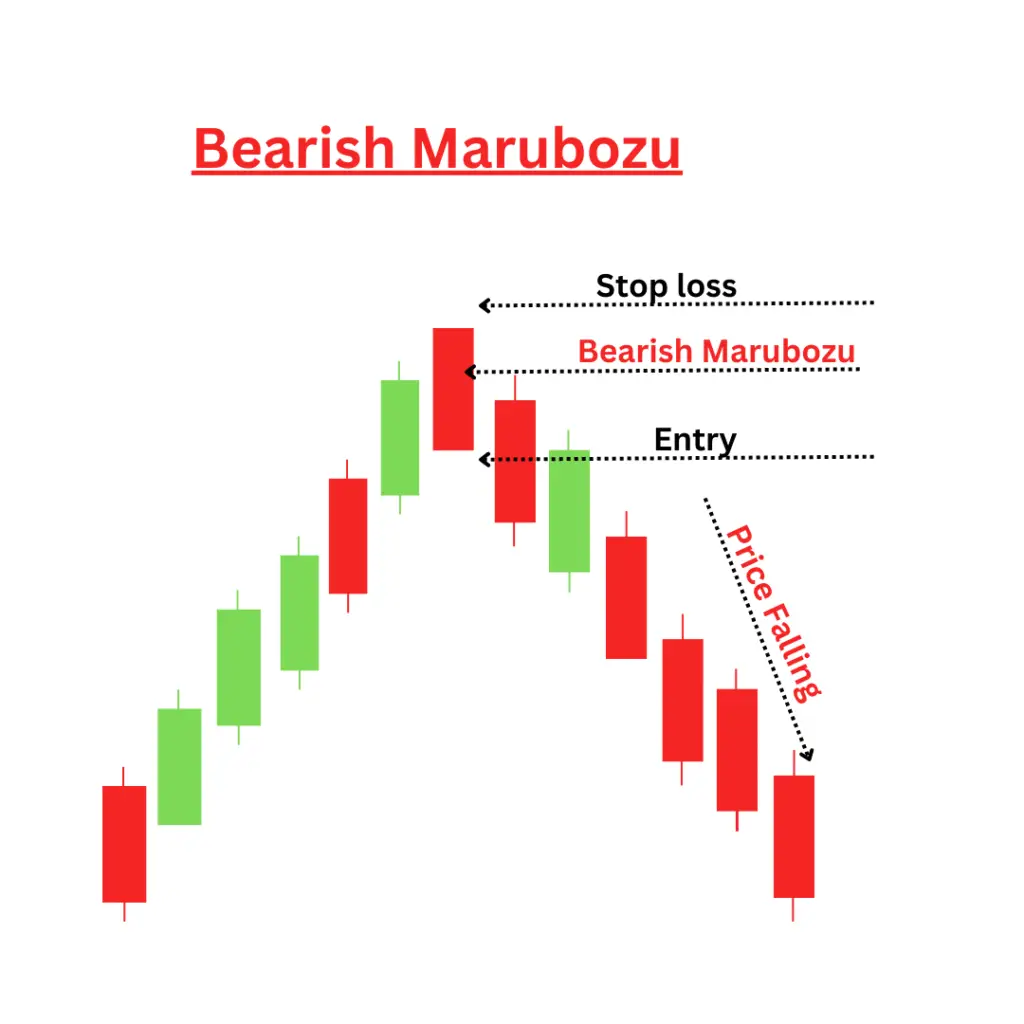
A Bearish Marubozu shows that sellers dominated the market throughout the entire trading session, pushing prices down from open to close.
If this pattern appears during a downtrend, it may confirm the continuation of the bearish trend. If it forms at the top of an uptrend, it can signal a potential reversal into a downtrend.
Traders often consider entering a short position after confirmation from a bearish candle following Marubozu. Targets can be set based on previous support levels or other technical analysis tools.
How to Use Bearish Candlesticks Patterns in Trading
- Confirm with Volume: High trading volume strengthens the reliability of the pattern.
- Look for Resistance Levels: Bearish patterns are stronger when they appear near resistance zones.
- Combine with Other Indicators: Use moving averages, RSI, or MACD for confirmation before making trading decisions.
- Use Stop-Loss Orders: To manage risk, set stop-loss levels above key resistance zones.
Bearish candlesticks patterns are valuable tools for traders to anticipate market downturns. By recognizing these patterns and combining them with other technical indicators, traders can make informed decisions and manage risks effectively.
Disclaimer
The content on this platform is for informational and educational purposes only and should not be considered financial, investment, or legal advice. While we strive to provide accurate and up-to-date information, we do not guarantee the completeness, reliability, or suitability of the information provided. Before making any financial decisions, please consult with a qualified financial advisor or conduct your own research.


[…] 4: Look for Chart Patterns: Recognize formations like head and shoulders, double tops/bottoms, and flags that indicate […]
[…] of the future prices. There are two types of candlestick patterns, bullish candlesticks patterns and bearish candlesticks patterns. Investors and traders use this pattern because they allow complex market data to be expressed in a […]
I don’t think the title of your article matches the content lol. Just kidding, mainly because I had some doubts after reading the article.
Thank you for your sharing. I am worried that I lack creative ideas. It is your article that makes me full of hope. Thank you. But, I have a question, can you help me?